Tops and Bottoms
Double tops and bottoms
Double tops and double bottoms are reversal formations, signalling to chartists that a sustained trend may be about to reverse.
Double tops typically occur when two successive moves higher are sold into, creating two peaks on the chart. The low point between these two highs is known as the ‘neckline’, and the pattern culminates with a break through this level.
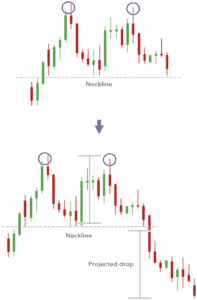
On this occasion you can see that the second top fails to break above the initial high. This indicates that the uptrend may have finished and a reversal is likely. If you’re going to trade using this pattern it’s sensible to enter your short trade below the neckline, when the pattern is fully formed (particularly as another pattern might be forming, such as a ‘triple top’ – see below).
The benefit of trading a pattern such as a double top is that it gives you a price target. In other words, you can project how far the price might fall after it breaks through the neckline. The drop is often likely to be equal to the distance from the neckline to the highest peak, as shown in blue on the chart above.
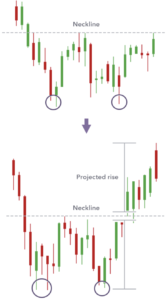
Double bottoms work the same way as double tops but in the opposite direction, indicating a bullish trend reversal after a sustained downtrend.
Triple tops and bottoms
The same as double tops and bottoms, except the market hits the support or resistance level three times before reversing.